
Energy and climate change
We take action to mitigate the impact of our activities on climate change.
2027
carbon neutrality commitment
-45%
scope 1 & 2 emissions
(vs 2018)
71%
renewable electricity
used
by 2027
Climate change is one of the biggest threats facing society. At ST, we recognize we have a responsibility to help address this global challenge.
In 2020, we announced our commitment to becoming carbon neutral by 2027 on scope 1 and 2, and partially scope 3. Our carbon neutrality program includes:
- a comprehensive strategy covering the reduction of direct and indirect greenhouse gas (GHG) emissions, including product transportation, business travel, and employee commuting
- the sourcing of 100% renewable energy by 2027
- an intermediate milestone, to be achieved by 2025, with full compliance with the 1.5°C scenario defined in the Paris Agreement adopted at COP21, endorsed by the Science Based Targets initiative (SBTi)
Moving towards carbon neutrality
Our carbon neutrality program comprises five main workstreams: 3-3
- reducing our direct emissions
- investing in energy savings
- using renewable energies
- minimizing our indirect emissions
- offsetting remaining emissions
The programs in place at all our manufacturing sites address our direct and indirect emissions in accordance with scopes 1, 2, and partially 3 of the GHG Protocol. In 2023, we continued our progress towards carbon neutrality and, although there was an increase in our scope 1 and part of scope 3 emissions, we decreased our CO2 equivalent emissions by 10.5% per unit of production compared to 2022.
Breakdown of GHG emissions305-1305-2305-3

Reducing our direct emissions
Our direct emissions, as defined by scope 1 of the GHG Protocol, represent more than 50% of our total GHG emissions.
The use of perfluorinated compounds (PFC) in the manufacture of semiconductors accounts for a significant share of our direct air emissions, as defined by scope 1 of the GHG protocol. It is therefore a central part of our environmental strategy to reduce their use and ensure they are treated appropriately before being released into the atmosphere. In 2023, we installed and activated 53 new PFC abatement systems in several of our sites. Our Ang Mo Kio site (Singapore) installed 18 additional abatement systems to reduce PFCs. Abatement systems were also installed across multiple other sites: 12 in Catania (Italy), 11 in Agrate (Italy), 10 in Crolles (France) and 2 in Tours (France).
In 2023, we updated our methodology to calculate GHG emissions from PFC use. We adopted the 2019 refinement to the IPCC Guidelines for National Greenhouse Gas Inventories to align with the World Semiconductor Council’s recommendation of May 2023. The updated methodology along with an increase in our production, have resulted in a 2% increase in our scope 1 direct emissions reported in absolute values. Due to the change in methodology, our PFC emissions per unit of production remained stable, despite the installation of new PFC abatement systems.
FOCUS

Calculating our direct emissions
In 2023, ST adopted the 2019 refinement to the IPCC Guidelines for National Greenhouse Gas Inventories in alignment with the World Semiconductor Council’s recommendation. The refinement provides updated methodologies, taking into consideration more recent scientific data, to calculate greenhouse gas emissions from PFC usage in the semiconductor industry.
Among the methodologies proposed, ST decided to adopt theTier 2c method based on over ten thousand data sets supplied to the IPCC working group by companies and suppliers. It was selected due to its precision and greater scope. It considers how gases are used in different processes and the by-products created. The new method also has rules for emissions reduction technologies which need to be tested and certified to meet certain standards and avoid the formation of other harmful gases.
The revised method is now used in all our front-end manufacturing sites and helps us to generate more robust data for our direct emissions. The system also provides enhanced transparency and increased comparability, which will allow us to improve our decision-making.
Investing in energy saving
In 2023, our absolute energy consumption increased by 7% compared to 2022. This was due to an increase in the use of advanced manufacturing technologies, some of which have a higher manufacturing footprint, but the devices produced consume less energy in the end application. Despite this, we decreased our energy consumption per unit of production by 17% compared to 2016, in line with our 2025 goal of a 20% reduction.
All our manufacturing sites develop initiatives to optimize their energy consumption. At the end of 2023, thanks to energy savings and projects to reduce CO2 emissions, our annual energy saving was approximately 139GWh, comprising 115GWh of electricity and 24GWh of methane gas, compared to 112GWh in 2022. This is in line with our objective to save at least 150GWh per year by 2027. 302-4
In 2023, our sites continued to implement a number of energy-saving initiatives. At our Ang Mo Kio site (Singapore), a program was initiated to replace older auxiliary vacuum pumps with more efficient models. The project saved 2.2GWh in 2023 and the same equipment has since been upgraded at the majority of front-end manufacturing sites. Additionally, our Rousset site (France) completed a project to retrofit 27 scrubbers, resulting in a saving of 3.0GWh and 600 metric tons of CO2.
To explore ways to achieve further energy savings, ST collaborated with EDF DALKIA to conduct assessments across all French sites. As a result of this initiative, our Crolles site (France) implemented adiabatic cooling towers to cool air compressors. This method uses evaporation to cool water and is more efficient than traditional chillers. The initiative resulted in an energy saving of 0.9GWh in 2023.
In addition, we focused on implementing technical best practices for designing, constructing, and revamping our systems. This delivered immediate benefits with practically no additional costs, contributing significantly to our total energy savings.
We also worked with energy-saving experts to identify other potential actions that could be implemented in France and Italy between 2025 and 2027. These will help us reach our targets for 2027 and make further progress towards our sustainability goals.
Using renewable energies
71%
renewable electricity
Electricity counts for 92% of the energy we use. Renewable sources provided 71% of the electricity we purchased in 2023, compared to 62% in 2022. Green sourcing helped us avoid the equivalent of 636,000 metric tons of CO2 emissions, largely by purchasing more green electricity certificates.
In 2023, ST signed a 15-year power purchase agreement (PPA) with ERG for the supply of renewable electricity to our sites in Italy. The agreement will cover our two high-volume manufacturing sites in Agrate and Catania, as well as multiple R&D, design, and sales and marketing sites. The PPA will provide approximately 250GWh of renewable energy per year from Sicilian wind farms, equivalent to a total volume of 3.75TWh over 15 years.
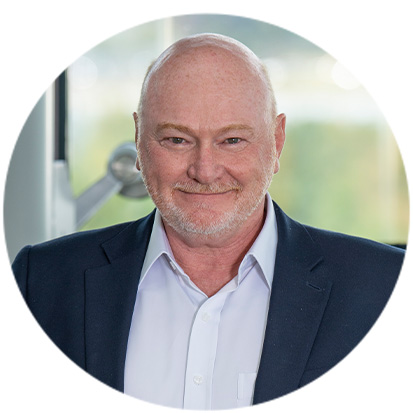
Geoff West
Executive Vice President and Chief Procurement Officer
The Power Purchase Agreement with ERG marks yet another important step towards ST’s goal of becoming carbon neutral in its operations (scope 1 and 2 emissions, and partially scope 3) by 2027, including the sourcing of 100% renewable energy by 2027. PPAs will play a major role in our transition. Starting in 2024, the PPA will provide a significant level of renewable energy for ST’s operations in Italy, which include R&D, design, sales and marketing, and large-volume chip manufacturing.
As part of our move towards more renewable energy sourcing, our Bouskoura site (Morocco) has a PPA for the electricity produced by 12 wind turbines. In 2023, these turbines supplied 47% of the power used by the site, avoiding around 31,000 metric tons of CO2 emissions.
In 2022, the site extended its 4,000m2 photovoltaic carport with an additional 3,100m2 of solar panels. The installation supplied more than 1.9GWh of electricity in 2023, which partially powers the site’s cleanroom.
Similarly, solar power installations at our site in Catania (Italy) produced 1.8GWh of green electricity.
The photovoltaic carport installed at our Grenoble site (France) started to generate power in December 2022. The 10,900m2 of solar panels will produce 2.7GWh of electricity annually, from 2024.
Solar and wind PPAs will play a major role in our transition to 100% renewable electricity by 2027. Cross-functional teams have continued to work on our energy procurement strategy. Our ambition is to identify new-build project opportunities which meet ‘additionality’ criteria. This means selecting projects that bring new capacity into the grids in locations where we operate. To achieve this, we will initiate strategic and long-term partnerships.
Minimizing our indirect emissions from transportation
From 15 material topics defined in scope 3 of the GHG Protocol, we have selected three areas to report where we can maximize our impact:
- goods transportation
- employee commuting
- business travel
Goods transportation accounts for 49% of our scope 3 emissions, with employee commuting representing 32%. In 2023, we noted a 8.4% increase in our total scope 3 emissions compared to 2022. Emissions due to goods transportation increased by 3.6%, partly due to higher production volumes. However, we achieved a reduction of 10.5% in emissions related to employee commuting, despite a headcount increase. To support this positive trajectory, our sites reinforced sustainable employee commuting concepts, promoting green transportation, including car sharing. Flexible working arrangements, such as working from home, also help to minimize our emissions and we prioritize remote meetings where possible.
In 2023, our Tours site (France) received Gold Pro-Bike Employer label, a certification in recognition of its efforts to encourage employees to commute to work responsibly. In addition, our Rennes site (France) received a ‘Mobil Employeur 2023’ gold level award for successfully promoting alternative modes of transport to work. Its responsible commuting initiative was launched 10 years ago and has led to a reduction from 81% to 38% in employees travelling to work individually in cars. This was achieved by promoting alternative methods such as carpooling, cycling, and public transport, and increased work from home options. 305-3
Offset remaining emissions
Our current environmental programs and data do not include carbon offset projects, which are the final element of our carbon neutrality program.
We are developing a balanced portfolio of offset projects based on a long-term commitment to local projects and innovative solutions. In 2023, we investigated potential projects and partners that fit our offsetting criteria. We focus on the quality of carbon credit certificates generated and have selected an external advisor to identify the most suitable partners. Our aim is to combine nature-based solutions with technology solutions, for both carbon removal and avoidance. We will select and develop these projects in the coming years in collaboration with our stakeholders, according to local opportunities and needs.
Addressing climate-related risks
Addressing natural hazards risks
Since 2020, when we declared our support for the Task Force on Climate-related Financial Disclosures (TCFD), we have been working towards implementing TCFD recommendations (see also Risk management and TCFD index).
We adopt a double perspective when considering climate-related risks:
- impact of our activities on the environment and people
- impact of climate change on our activities
In 2023, we continued to work to address physical risks resulting from climate change that are either chronic (induced by longer-term shifts in climate patterns) or acute (event-driven) in a way that is consistent with the TCFD and the EU Green Deal classification, as illustrated in the following chart.
|
Temperature-related |
Wind-related |
Water-related |
Solid mass-related |
||
|---|---|---|---|---|---|---|
Chronic |
Changing temperature (air, freshwater, marine water) |
Changing wind patterns |
Changing precipitation patterns and types |
Coastal erosion |
||
Heat stress |
|
Precipitation or hydrological variability |
Soil degradation |
|||
Temperature variability |
|
Ocean acidification |
Soil erosion |
|||
Permafrost thawing |
|
Saline intrusion |
Solifluction |
|||
|
|
Sea level rise |
|
|||
|
|
Water stress |
|
|||
Acute |
Heat wave |
Cyclone, hurricane, typhoon |
Drought |
Avalanche |
||
Cold wave/frost |
Storm (including blizzards, dust and sandstorms), including medicanes |
Heavy precipitation (rain, hail, snow/ice) |
Landslide |
|||
Wildfire |
Tornado |
Flood (coastal, fluvial, pluvial, groundwater) |
Subsidence |
|||
|
|
Glacial lake |
|
|||
|
|
|
|
|
||
|
Covered by climate change study |
Covered by specific site studies when required |
||||
|
Covered by water scarcity study |
Non-applicable to ST footprint |
||||
|
||||||
In 2023, we commissioned an update of the science-based study from an expert third-party to assess the current and future climate risks on our 155 most critical locations (including all our main sites and those of our key manufacturing and logistics partners in our supply chain, located in 25 countries). To guide our adaptation efforts, the analysis was based on two climate change scenarios defined by the United Nations Intergovernmental Panel on Climate Change (IPCC):
- SSP2-4.5 (mid-century warming of 1.6 to 2.5°C, end of century warming of 2.1 to 3.5°C versus pre-industrial era)
- SSP5-8.5 (mid-century warming of 1.9 to 3°C, end of century warming of 3.3 to 5.7°C versus pre-industrial era)
For each scenario and for each of the 155 locations, climate projections on 2030 and 2050 time horizons show likely evolutions across a range of indicators based on the European Taxonomy classification of climate-related hazards, including:
- cyclonic and non cyclonic wind gusts
- coastal and riverine floods
- number of very heavy precipitation days
- freezing conditions such as cold wave duration, number of frost days, or percentage of very cold days
- extreme heat conditions, including heatwave duration and percentage of very warm days
- drought including dry wave duration and water stress
- landslides, mud flows, rock falls
A study commissioned in 2021, from an environmental consultancy, has been a valuable resource to help us better understand the characteristics and impact of water scarcity and our carbon footprint (see Water).
In addition to these global analyses, site-specific studies on natural hazards are also conducted where necessary due to local conditions.
Overall, the purpose of these different climate-related analyses is to feed our site-level business interruption risk assessments and business impact analyses, as well as our site resilience index. Ultimately, they feed into our regularly updated improvement, adaptation and mitigation plans addressing environmental and resilience issues in the medium- to long-term.
We are proactively addressing the transition to a lower-carbon economy. In this context, we are in the process of further identifying and assessing policy, legal, technology, and market transition risks, across the short-, medium- and long-term, as per the TCFD provisions. Simultaneously, we are actively investing in developing and launching new products to help our customers implement new energy-saving applications, transforming risk into opportunity (see Sustainable technology and Innovation).
Progress towards SBTi validated targets
As part of our carbon neutrality program, ST joined SBTi at the end of 2020. This initiative provides a clearly defined pathway for companies to reduce their GHG emissions. We were the first semiconductor company with approved targets to limit warming to no more than 1.5°C.
Our SBTi approved targets related to 1.5°C compliance are intermediate targets within our carbon neutrality commitment:
- 50% reduction of direct (scope 1) and indirect (scope 2) emissions by 2025 compared to 2018
- 80% renewable electricity sourcing by 2025
By the end of 2023, we were on track towards these targets, achieving 45% and 71%, respectively.
Progress towards carbon neutrality(1,2)

(1) 2006 IPCC Guidelines for National Greenhouse Gas inventories used for 2018 to 2022 data. 2019 refinement to the 2006 IPCC methodology used for 2023 data.
(2) Covers our 11 main manufacturing sites, plus Rennes, Castelletto and Grenoble.
Contributing to the SDGs
Our commitments and programs described above contribute to UN Sustainable Development Goals (SDGs):

SDG target 7.3 – By 2030, double the global rate of improvement in energy efficiency.

SDG target 8.4 – Improve progressively, through 2030, global resource efficiency in consumption and production.

SDG target 13.1 – Strengthen resilience and adaptive capacity to climate-related hazards and natural disasters in all countries.
2027 sustainability goal |
Status |
Comments |
SG9: Be carbon neutral by 2027 in all direct and indirect emissions from scope 1 and 2, and focusing on product transportation, business travel and employee commuting emissions for scope 3. |
|
906KT net CO2 eq emissions |
SG10: Adopt 100% renewable energy sources by 2027 through energy procurement and green energy installations. |
|
71% of total electricity |
SG11: Implement programs to reduce energy consumption by at least 150GWh per year by 2027. |
|
27GWh saved in 2023 |
2025 sustainability goal |
Status |
Comments |
SG12: Reduce energy consumption per wafer by 20% in 2025 vs 2016. |
|
-17% |
80% of renewable electricity by 2025. |
|
71% |
-50% absolute Scope 1 and Scope 2 GHG emissions by 2025 (2018 baseline). |
|
-45% |